The report opens, the spinner turns, and everyone blames “the network”. I look at the number of queries first. A class of thirty students that loads grades one by one is not a slow network. It is thirty round trips we wrote ourselves.
The trap, written plainly
This view looks honest. It is not.
from django.http import JsonResponse
from app.models import Eleve

def reports(request):
    rows = []
    for eleve in Eleve.objects.all():
        rows.append({
            "nom": eleve.nom,
            "notes": list(eleve.notes.values("matiere", "valeur")),
        })
    return JsonResponse({"lignes": rows})
Eleve.objects.all() is one query. eleve.notes inside the loop issues another, every turn. Thirty students, thirty-one queries. Three hundred students, the same code, three hundred and one queries. The page did not change. The cost did.
One read, not a loop of trips
prefetch_related fetches the grades in a second query, then attaches them in memory. The count no longer depends on the size of the class.
def reports(request):
    eleves = Eleve.objects.prefetch_related("notes").order_by("nom")
    rows = [
        {
            "nom": eleve.nom,
            "notes": [
                {"matiere": note.matiere, "valeur": note.valeur}
                for note in eleve.notes.all()
            ],
        }
        for eleve in eleves
    ]
    return JsonResponse({"lignes": rows})
eleve.notes.all() here does not go back to the database. It reads what was already fetched. If you put a fresh Django filter inside that loop, you open the hole again.
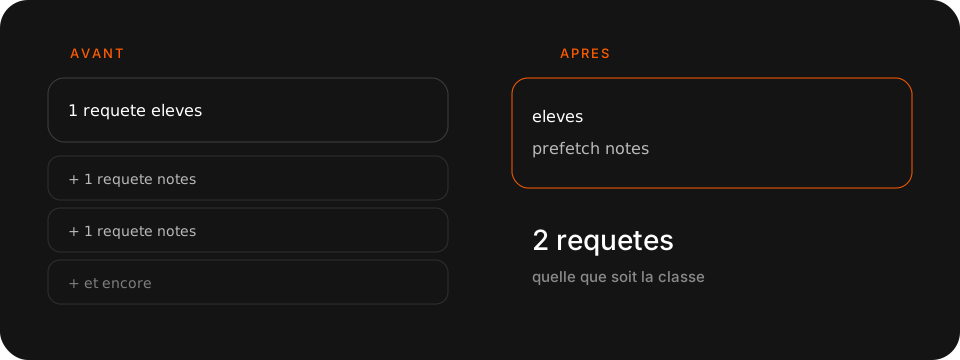
Example
A class of 30, 4 grades each.
- Before: 1 + 30 = 31 queries, and the page waits for the last one.
- After: 2 queries, students then grades, whatever the headcount.
The JSON coming back does not change. Only the path changes. That is the test: same response, fewer trips.
Count before you optimise somewhere else
python manage.py shell -c "
from django.db import connection, reset_queries
from app.models import Eleve
reset_queries()
list(Eleve.objects.prefetch_related('notes'))
print(len(connection.queries))
for query in connection.queries:
    print(query['sql'][:120])
"
I want to see 2, not 31. If the number stays high, I open the PostgreSQL plan on the slowest query, not a cache in front of the symptom.
python manage.py dbshell -c "EXPLAIN ANALYZE SELECT id, nom FROM app_eleve ORDER BY nom;"An index on nom is justified when that plan sorts the whole table. Not before you have read it.